| 1 | 2 | 3 | 4 | 5 | 6 | |||||||
|---|---|---|---|---|---|---|---|---|---|---|---|---|
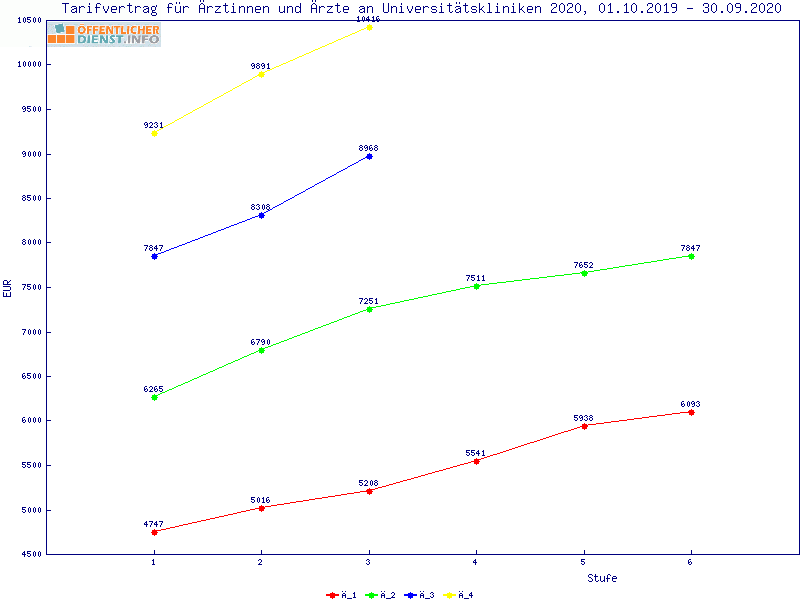
| Ä 1 | 4747.01 | 269.07 +5.67% +5.67% | 5016.08 | 192.18 +3.83% +3.83% | 5208.26 | 333.15 +6.40% +6.40% | 5541.41 | 397.16 +7.17% +7.17% | 5938.57 | 154.91 +2.61% +2.61% | 6093.48 | |
| -1518.28 -24.23% | -1774.53 -26.13% | -2043.60 -28.18% | -1969.64 -26.22% | -1713.78 -22.40% | -1754.16 -22.35% | |||||||
| Ä 2 | 6265.29 | 525.32 +8.38% +2.72% | 6790.61 | 461.25 +6.79% +2.21% | 7251.86 | 259.19 +3.57% +1.77% | 7511.05 | 141.30 +1.88% +0.94% | 7652.35 | 195.29 +2.55% +1.27% | 7847.64 | |
| -1582.35 -20.16% | -1518.28 -18.27% | -1716.86 -19.14% | ||||||||||
| Ä 3 | 7847.64 | 461.25 +5.88% +1.92% | 8308.89 | 659.83 +7.94% +2.58% | 8968.72 | |||||||
| -1383.76 -14.99% | -1582.33 -16.00% | -1447.80 -13.90% | ||||||||||
| Ä 4 | 9231.40 | 659.82 +7.15% +2.33% | 9891.22 | 525.30 +5.31% +1.74% | 10416.52 |
| Legende: |  |
 |