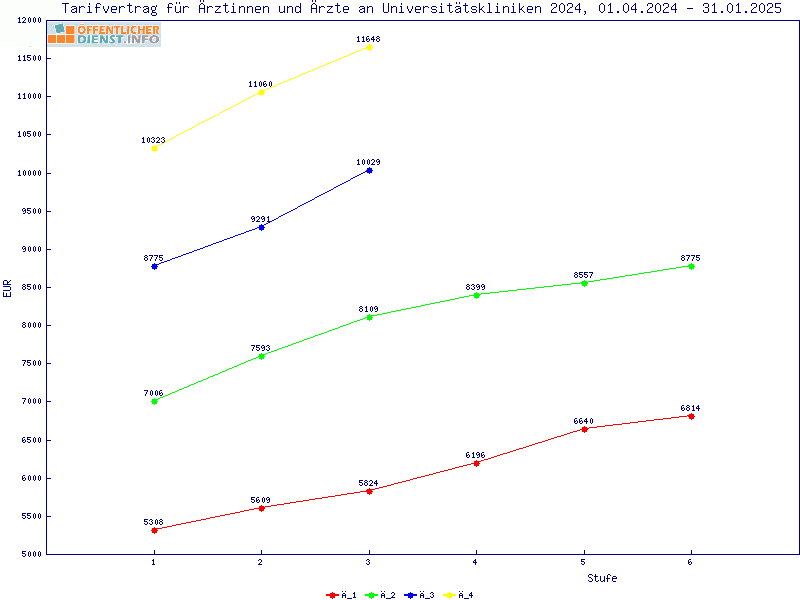


| 1 | 2 | 3 | 4 | 5 | 6 | |||||||
|---|---|---|---|---|---|---|---|---|---|---|---|---|
| Ä 1 | 5308.41 | 300.89 +5.67% +5.67% | 5609.30 | 214.92 +3.83% +3.83% | 5824.22 | 372.54 +6.40% +6.40% | 6196.76 | 444.13 +7.17% +7.17% | 6640.89 | 173.23 +2.61% +2.61% | 6814.12 | |
| -1697.84 -24.23% | -1984.40 -26.13% | -2285.27 -28.18% | -2202.58 -26.22% | -1916.46 -22.40% | -1961.61 -22.35% | |||||||
| Ä 2 | 7006.25 | 587.45 +8.38% +2.72% | 7593.70 | 515.79 +6.79% +2.21% | 8109.49 | 289.85 +3.57% +1.77% | 8399.34 | 158.01 +1.88% +0.94% | 8557.35 | 218.38 +2.55% +1.27% | 8775.73 | |
| -1769.48 -20.16% | -1697.83 -18.27% | -1919.90 -19.14% | ||||||||||
| Ä 3 | 8775.73 | 515.80 +5.88% +1.92% | 9291.53 | 737.86 +7.94% +2.58% | 10029.39 | |||||||
| -1547.41 -14.99% | -1769.45 -16.00% | -1619.03 -13.90% | ||||||||||
| Ä 4 | 10323.14 | 737.84 +7.15% +2.33% | 11060.98 | 587.44 +5.31% +1.74% | 11648.42 |
| Legende: |  |
 |